The KPI Structure That Unlocks EcoVadis Points

Why your sustainability KPIs are not moving your EcoVadis score
Many sustainability managers tell me the same thing: "We have KPIs. We track them regularly. But our EcoVadis score does not move."
In most cases, the issue is not a lack of effort. It is a misalignment between what the company is measuring and what EcoVadis actually evaluates. You can track dozens of sustainability indicators and still miss the ones that would have earned you points.
After supporting over 200 EcoVadis assessments, I have seen this pattern repeat across industries and company sizes.
The good news is that fixing it is not complicated. It requires understanding which KPIs EcoVadis rewards, structuring them around the right framework, and presenting the data in a way that tells a clear story.
By the end of this article, you will understand:
why well-intentioned KPIs often fail to move your EcoVadis score
the specific indicators that consistently contribute to stronger ratings across all four themes
how to structure your KPI dashboard so it maps directly to EcoVadis assessment criteria
how to move from tracking data to evidencing impact
The core problem: tracking is not the same as evidencing
Most companies track sustainability data. They monitor energy consumption, record workplace accidents, keep supplier records. The data exists, often in multiple systems, reported to different stakeholders for different purposes.
But EcoVadis does not score the existence of data. It scores whether your KPIs are aligned with the risks in your industry, tracked consistently over time, and connected to the measures you have in place. An indicator you report internally for management purposes may not score at all if it is not structured the way EcoVadis expects to see it.
This is the shift that unlocks points. You stop asking "what can we measure?" and start asking "what does EcoVadis need to see, and how do we present it clearly?"
The KPIs that consistently move EcoVadis scores
Across the four EcoVadis themes, certain KPIs consistently contribute to stronger ratings. These are not the only indicators that matter, and your specific risk profile will determine which ones are most important for your company. But if you are looking for a starting point, these are the KPIs I see rewarded most consistently.
Environmental KPIs
Energy consumption. Total energy used, broken down by source where possible, with year-on-year trends. EcoVadis wants to see that you are measuring and actively managing consumption.
Scope 1, 2 and 3 emissions. All three scopes matter, and Scope 3 is increasingly central to strong environmental scores. Incomplete or outdated emissions data is one of the most common weaknesses in otherwise strong submissions.
Total weight of waste. Volume generated, ideally broken down by type (hazardous, non-hazardous, recycled, diverted from landfill). Trend data over multiple years is significantly stronger than a single-year snapshot.
Labour and Human Rights KPIs
Average training hours per employee per year. This indicator signals that your organisation invests systematically in developing its people. EcoVadis assesses both the volume and the breadth of training across different topics.
Number of work-related accidents. Occupational health and safety data, ideally including lost-time injury rates and year-on-year comparisons. Zero-incident reporting without context often raises questions rather than scoring well.
Percentage of women in the organisation. Broken down by seniority level where possible. Diversity and inclusion indicators carry meaningful weight in this theme.
Ethics KPIs
Number of confirmed corruption or information security incidents. The data point is important, but so is the context. A zero-incident report accompanied by evidence of active monitoring and whistleblowing mechanisms tells a different story than a bare number.
Percentage of employees trained on business ethics. Coverage of anti-corruption and code of conduct training across the organisation, ideally including refresher cycles and specialised training for higher-risk roles.
Sustainable Procurement KPIs
Percentage of suppliers who have signed the Supplier Code of Conduct. A foundational indicator that signals whether your sustainability expectations are formally communicated and accepted across your supply base.
Percentage of suppliers audited. Either through CSR-specific audits or integrated supplier assessments. This indicator gains weight when combined with evidence of follow-up on audit findings.
Why these KPIs work: the alignment principle
Every KPI that consistently moves EcoVadis scores shares three characteristics.
It is quantifiable. EcoVadis rewards measurable impact. Qualitative statements about commitment or effort do not score the way numbers do. If your sustainability work cannot be expressed as a number with a trend, you are leaving points on the table.
It is aligned with your risk profile. EcoVadis assigns a risk profile to every company based on industry, size and geography. A manufacturing company with a high environmental risk profile needs different KPIs than a professional services firm. Your KPIs should reflect the risks EcoVadis considers material for your specific business.
It is tracked over time. A single-year number is weaker than three years of trend data. EcoVadis wants to see direction of travel, not just current state. Even a KPI that shows a slight deterioration year on year can score well if the trend is explained and connected to corrective measures.
When these three characteristics are in place, the KPI starts doing its job in the assessment. It becomes evidence of a managed, mature system rather than a disconnected data point.
How to structure your EcoVadis KPI dashboard
One of the most common mistakes I see is KPIs scattered across multiple spreadsheets, different file formats and different departments. The data exists but it is not consolidated into a single, coherent document.
A strong EcoVadis KPI dashboard looks like this:
Structured around the four themes. Environment, Labour and Human Rights, Ethics, Sustainable Procurement. Each theme has its own clearly labelled section.
Contains multi-year data. Ideally three years of historical data, plus targets for future years. This shows both where you have been and where you are going.
Includes units and definitions. Every KPI is accompanied by a clear unit of measurement and, where relevant, a short definition of how it is calculated. Ambiguity costs points.
States coverage explicitly. Every KPI indicates whether it applies to the full organisation, specific sites or a defined scope. Where coverage is partial, the scope is named and any plans to extend are noted.
Is delivered as a single document. Not five spreadsheets, not twelve different files. One KPI dashboard that an assessor can open once and understand quickly.
The mistake that costs points: KPIs without narrative
Even a well-structured KPI dashboard can underperform if it is presented as numbers in isolation. Assessors do not just evaluate whether you measure the right things. They evaluate whether your measurements connect to the rest of your management system.
A strong KPI section tells a story. The policy commits to reducing emissions. The training programme teaches employees how. The audit process verifies that the measures are working. The KPI tracks the result.
When these elements are aligned, the KPI becomes part of a coherent narrative about how your organisation manages sustainability. When they are not, the KPI is just a number, and numbers without context are harder to credit.
How to move from tracking data to evidencing impact
If you recognise your company in this article and you want to close the gap between what you measure and what EcoVadis rewards, here is where I would start.
Audit your current KPIs against the four themes. For each EcoVadis theme, list what you currently track. Identify gaps. Identify indicators that are tracked but not aligned with your risk profile.
Consolidate your data into a single dashboard. Move away from scattered spreadsheets. One document, four themes, multi-year data.
Fill the most impactful gaps first. If Scope 3 emissions are missing, start there. If supplier audit data is incomplete, start there. Prioritise by the weight EcoVadis assigns to each theme for your industry.
Connect KPIs to policies and measures. For every KPI, you should be able to point to the policy commitment and the measure that drives the result. If that connection is missing, the indicator is not yet working as evidence.
How Kemi can help
I offer two paths for companies who want to get their EcoVadis KPIs right.
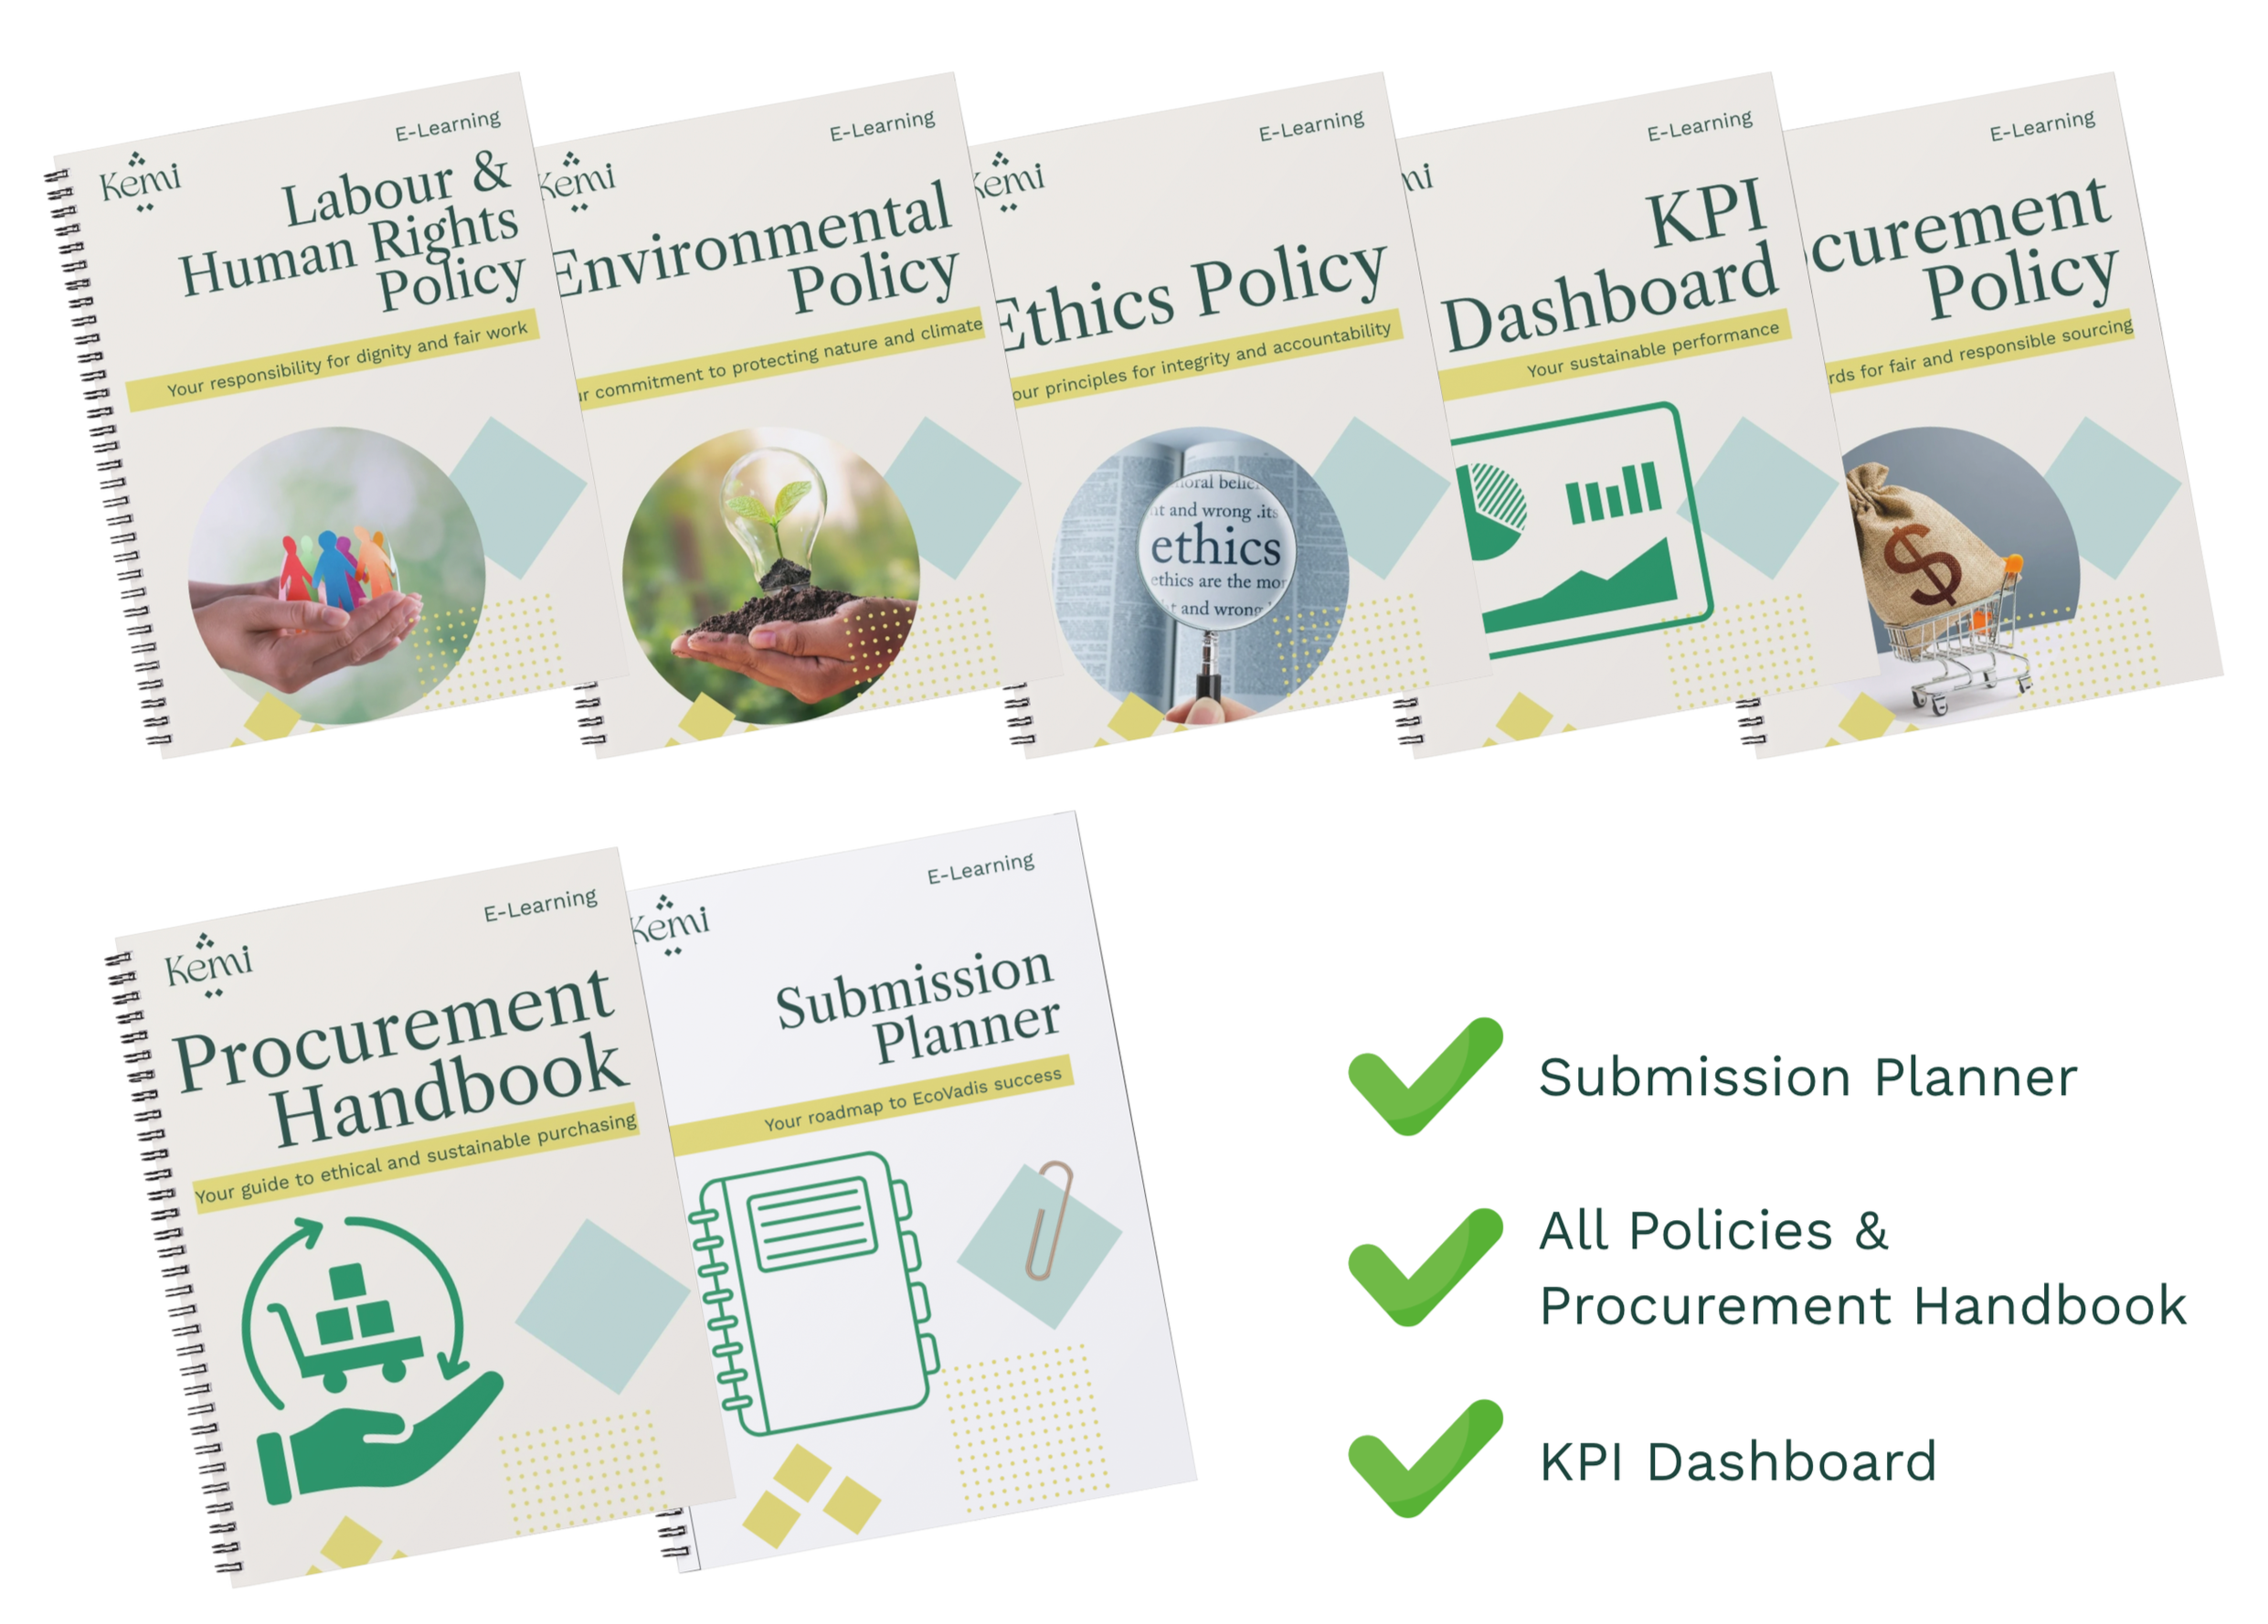
EcoVadis Templates. A structured KPI dashboard template built specifically around EcoVadis requirements. It covers all four themes, includes the indicators that consistently score, and provides the format that makes your data easy for assessors to evaluate. The template is part of the Templates package, alongside policy templates, a Procurement Handbook and a Submission Planner.
1:1 EcoVadis submission support. Direct expert guidance on which KPIs to prioritise for your specific risk profile, how to structure your dashboard, and how to connect your data to the rest of your submission.
FAQ | EcoVadis KPI Structure
Which EcoVadis KPIs are most important? It depends on your industry, size and risk profile. That said, certain indicators consistently carry weight across most profiles: Scope 1, 2 and 3 emissions, average training hours per employee, percentage of suppliers who signed the Supplier Code of Conduct, and number of work-related accidents. Your EcoVadis scorecard will show which themes carry the most weight for your specific company.
How many KPIs should I track for EcoVadis? There is no fixed number. What matters is coverage across the four themes and alignment with your risk profile.
Do I need historical data for my KPIs to score? Ideally yes. A single-year snapshot scores, but multi-year trend data scores significantly better. Three years of historical data is a good target. If you do not have historical data yet, start tracking now and present what you have honestly, with a commitment to build the trend over time.
Can I use the KPIs from my sustainability report for EcoVadis? Yes! A well-structured sustainability report is a strong source of KPI data for EcoVadis. What matters is that the indicators are clearly labelled, accompanied by units and coverage statements, and presented in a format the assessor can evaluate quickly. Ideally, you integrate your KPI dashboard into your sustainability report.
How do I know if my KPIs are aligned with my EcoVadis risk profile? In the tab ‘my performance’ in your EcoVadis account, you can click on your industry group under your company name. This shows you your risk profile and your activated criteria - ideally, you report a couple of KPIs per activated criterion!